
By Brad Heath, Mitchell Thorson, Jim Sergent
USA TODAY. November 9, 2016 —
A wave of disillusionment and anger — wide and by all appearances intensely felt — secured the presidency Tuesday for Donald Trump. He won by turning out victories in a wide swath of the United States, a base of support broad enough to secure him a strong majority in the Electoral College even though he lost the popular vote.
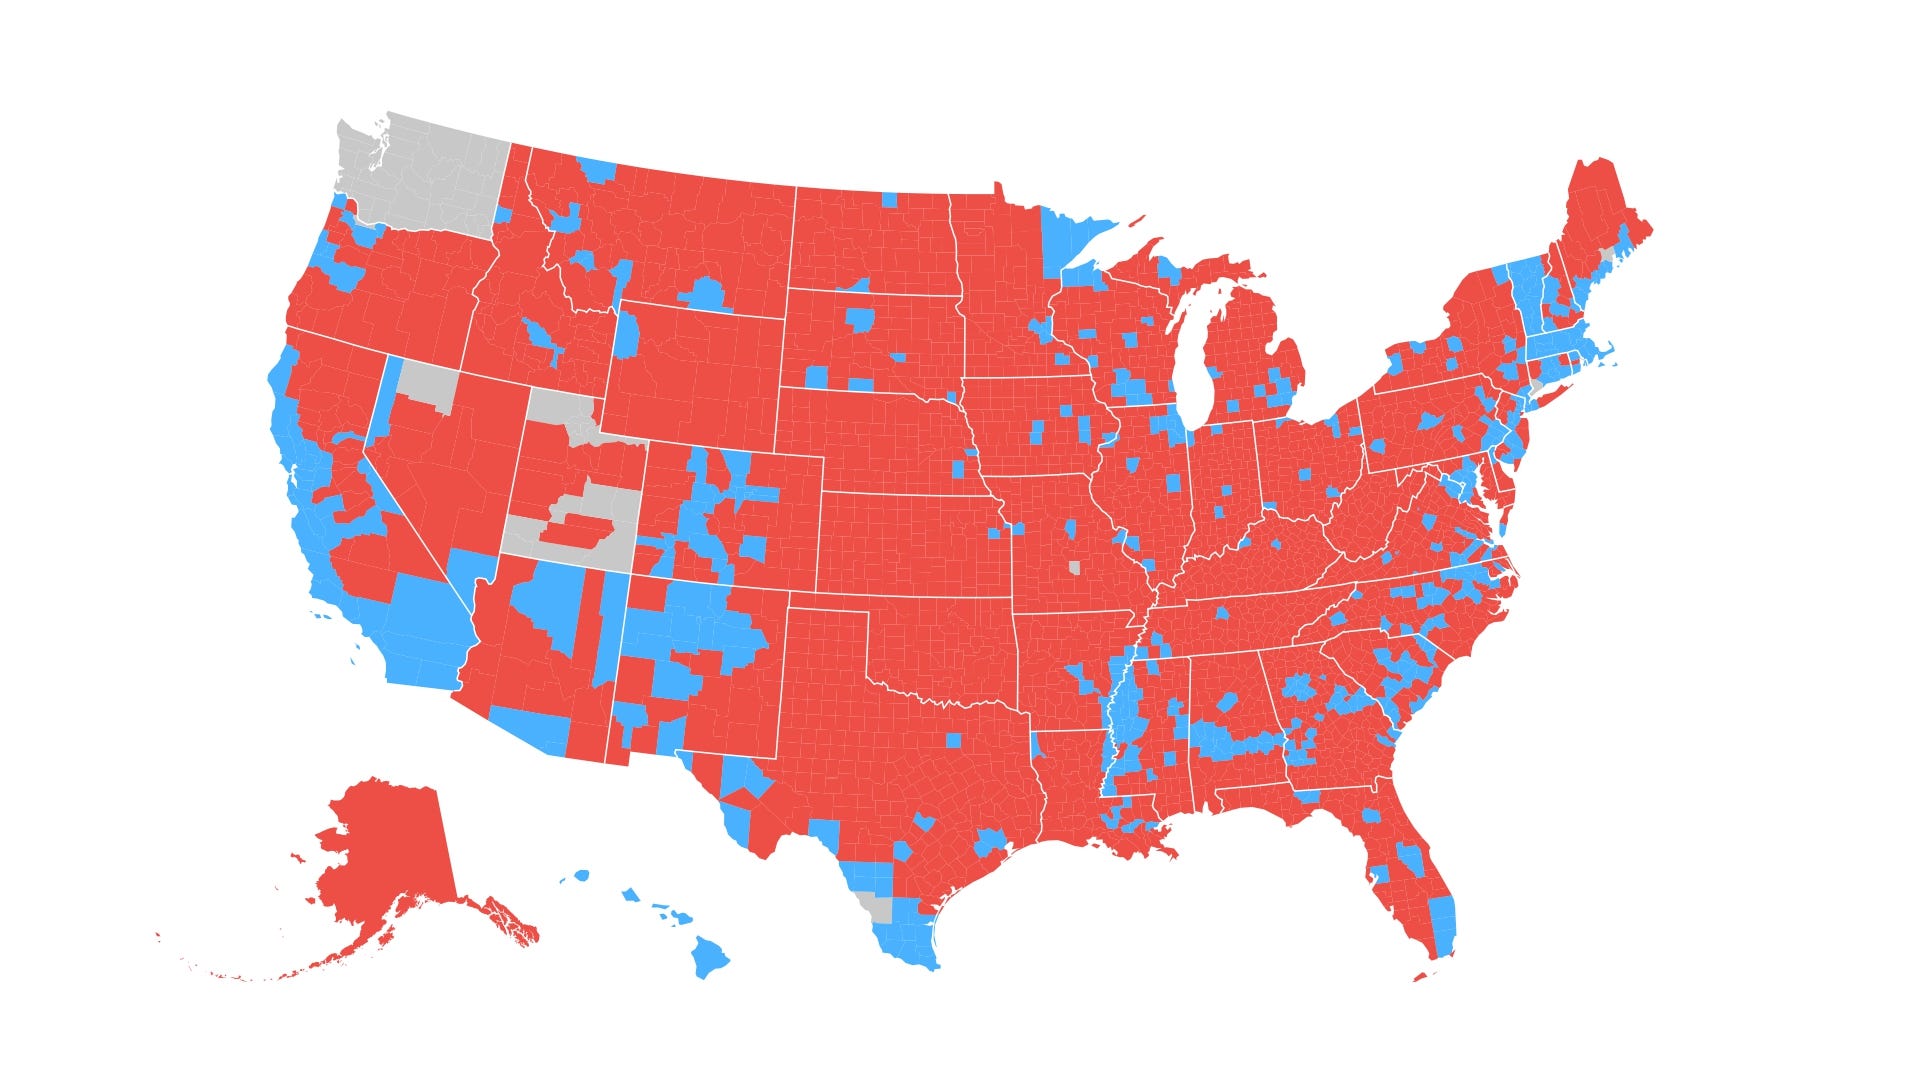
Republican – Red
Democrat – Blue
No result – Gray
Source: Associated Press, as of 4:30pm EST, Note: Alaska does not report county-level results.
TRUMP WON THE ELECTION BECAUSE:
Republican growth
He benefited from an eight-year shift toward the Republican Party. Comparing the margin of victory to the 2012 election, we can see that Trump outperformed Mitt Romney heavily in large portions of the country. The places where Hillary Clinton improved on President Obama’s 2012 numbers, while often populous, were insufficient to give her the votes to clinch victory in battleground states.
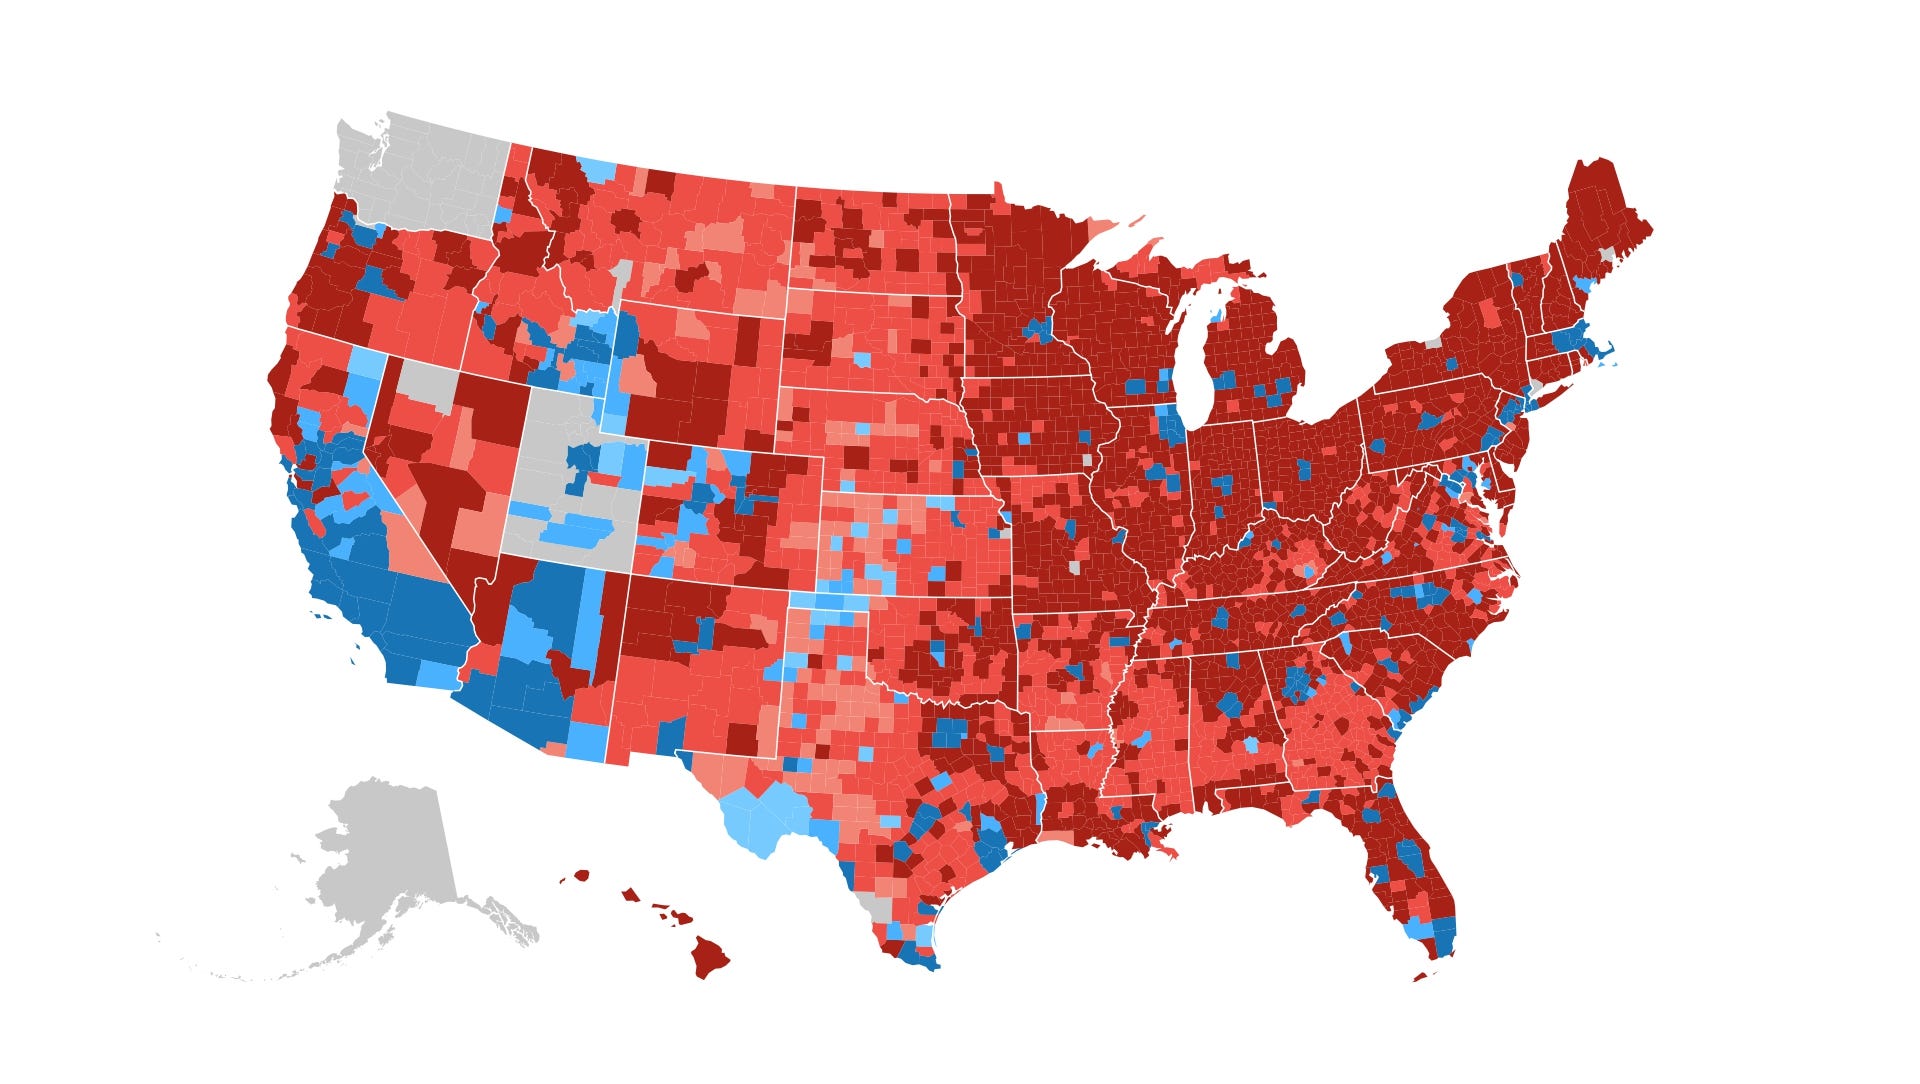
Net increase in vote margin:
1,000+ – Dark Blue
100-1,000 – Blue
0-100 – Light Blue
No result – Gray
0-100 – Pink
100-1,000 – Red
1,000+ – Maroon
Source: Associated Press, as of 4:30pm EST, Note: Alaska does not report county-level results.
Looking back even further, compared to the 2008 election, this trend is even more pronounced, as many counties, even traditionally liberal ones, have moved significantly to the right over the past 8 years. This map shows how Trump improved on John McCain’s margins in 2008.
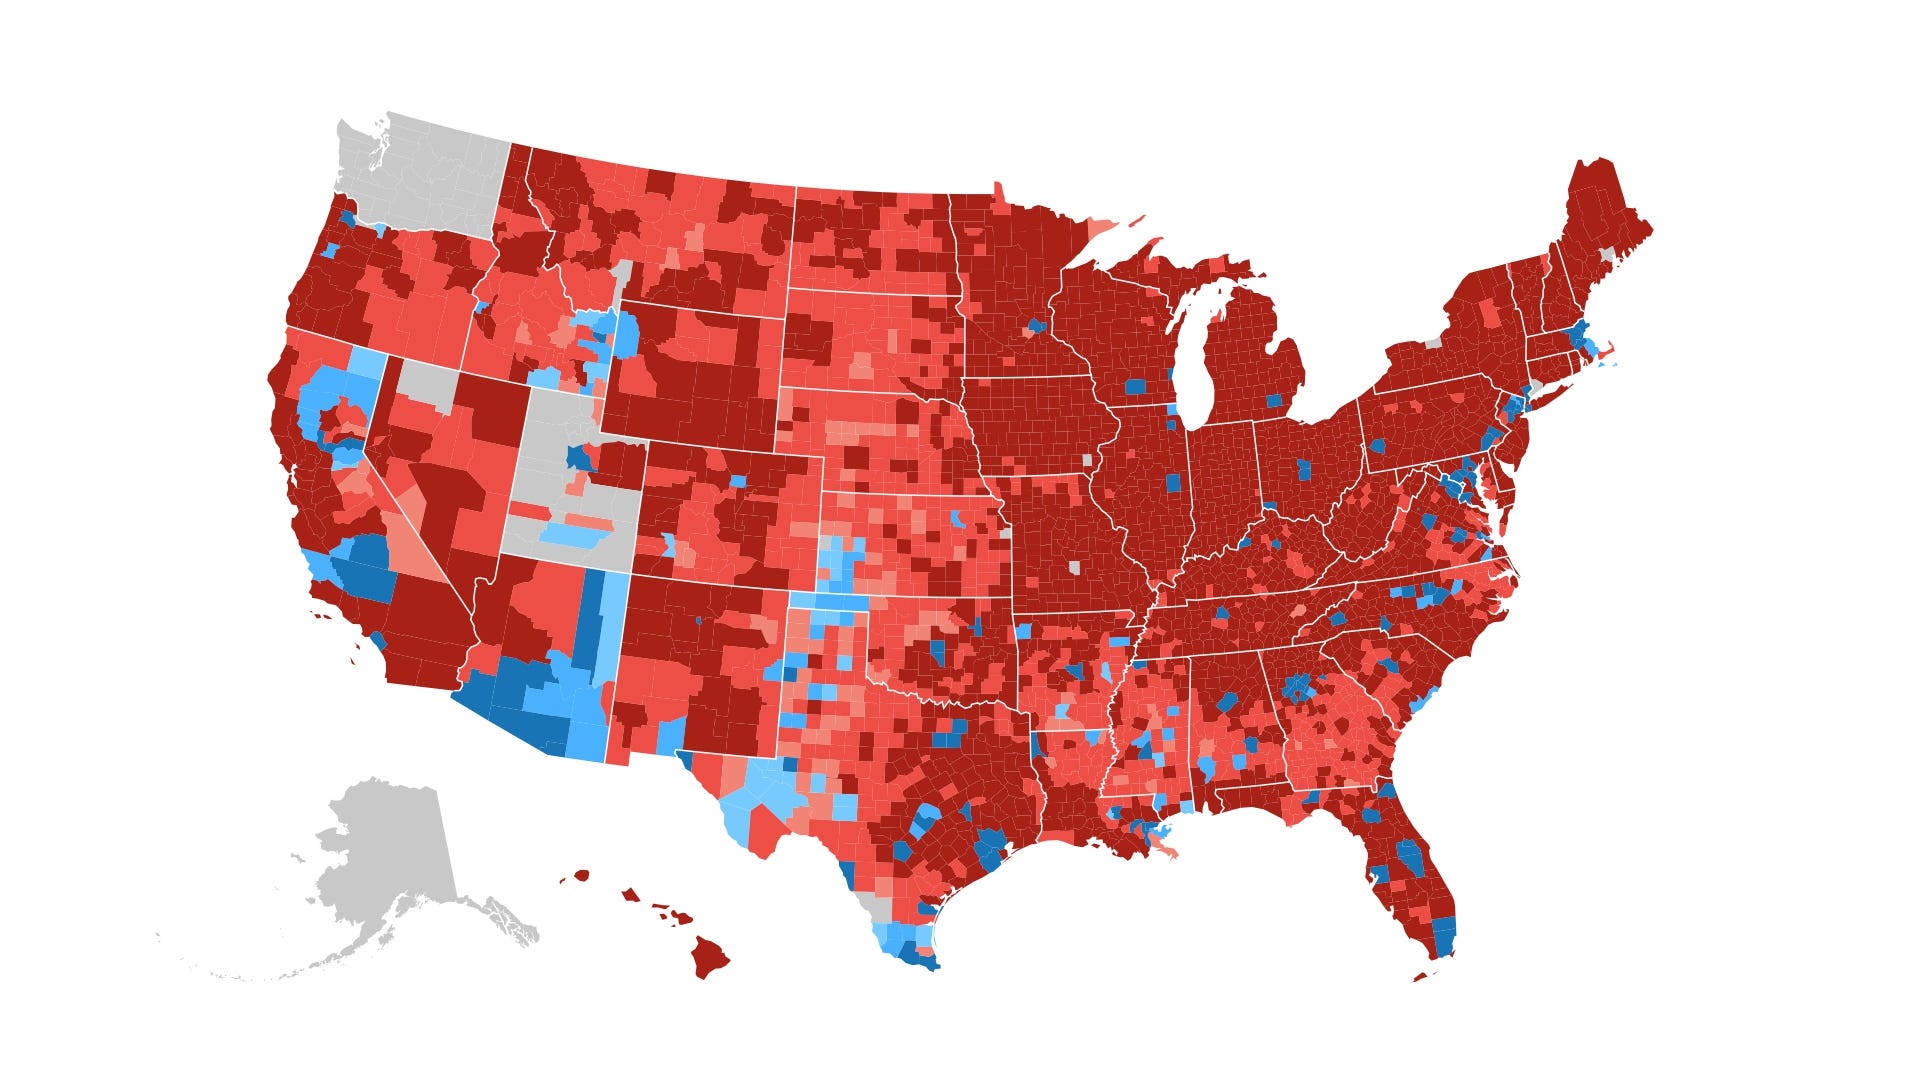
Net increase in vote margin:
1,000+ – Dark Blue
100-1,000 – Blue
0-100 – Light Blue
No result – Gray
0-100 – Pink
100-1,000 – Red
1,000+ – Maroon
Source: Associated Press, as of 4:30pm EST, Note: Alaska does not report county-level results.
RUST BELT Connection
Trump connected with voters in key portions of the Rust Belt which was the location of four key states that would be won or lost by thin margins: Michigan, Ohio, Pennsylvania and Wisconsin.
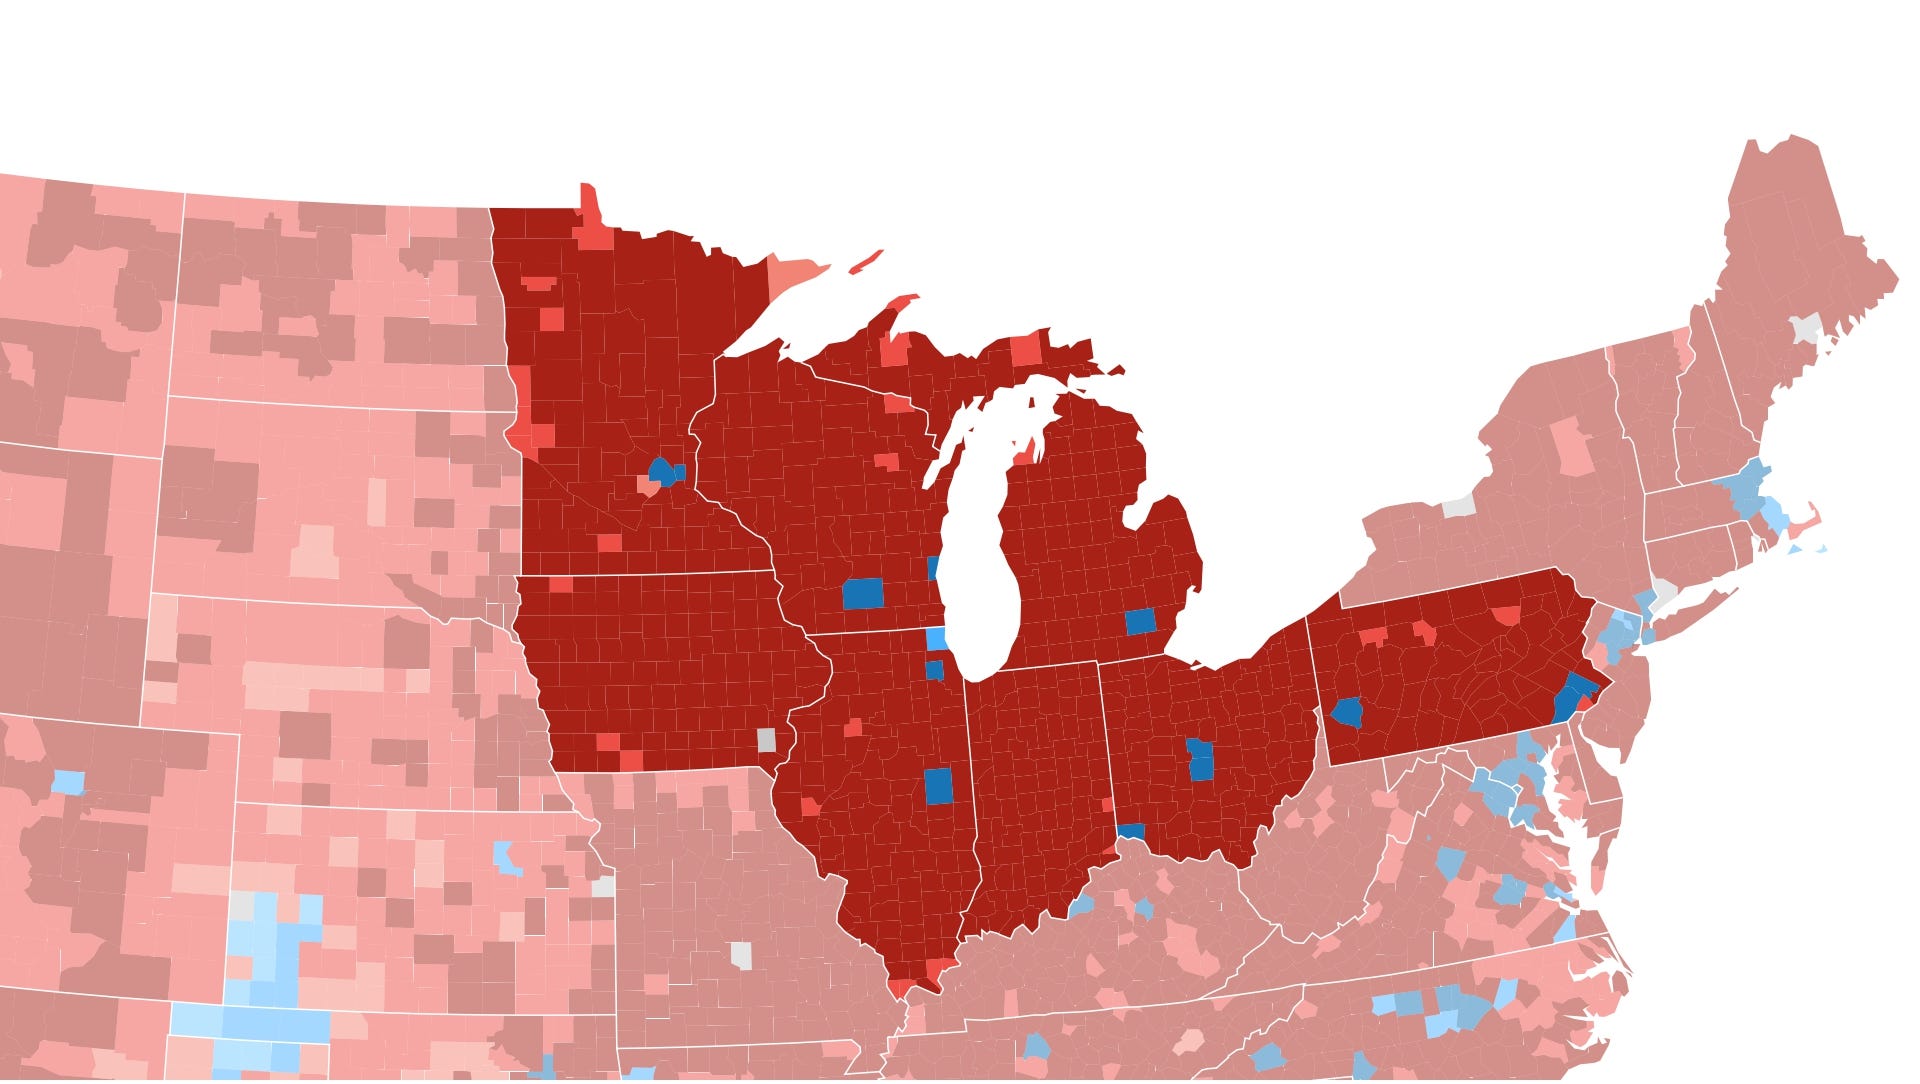
1,000+ – Dark Blue
100-1,000 – Blue
0-100 – Light Blue
No result – Gray
0-100 – Pink
100-1,000 – Red
1,000+ – Maroon
Source: Associated Press, as of 4:30pm EST, Note: Alaska does not report county-level results.
MANUFACTURING COUNTIES
Republican support in counties with the highest percent of the working population in manufacturing jobs.

And areas with large decreases in unemployment
Republican support in counties with the largest decreases in unemployed popula- tion rates from 2010 to 2014.

CLINTON LOST THE ELECTION BECAUSE:
Lower turnout in predominantly black areas and Democratic bastions
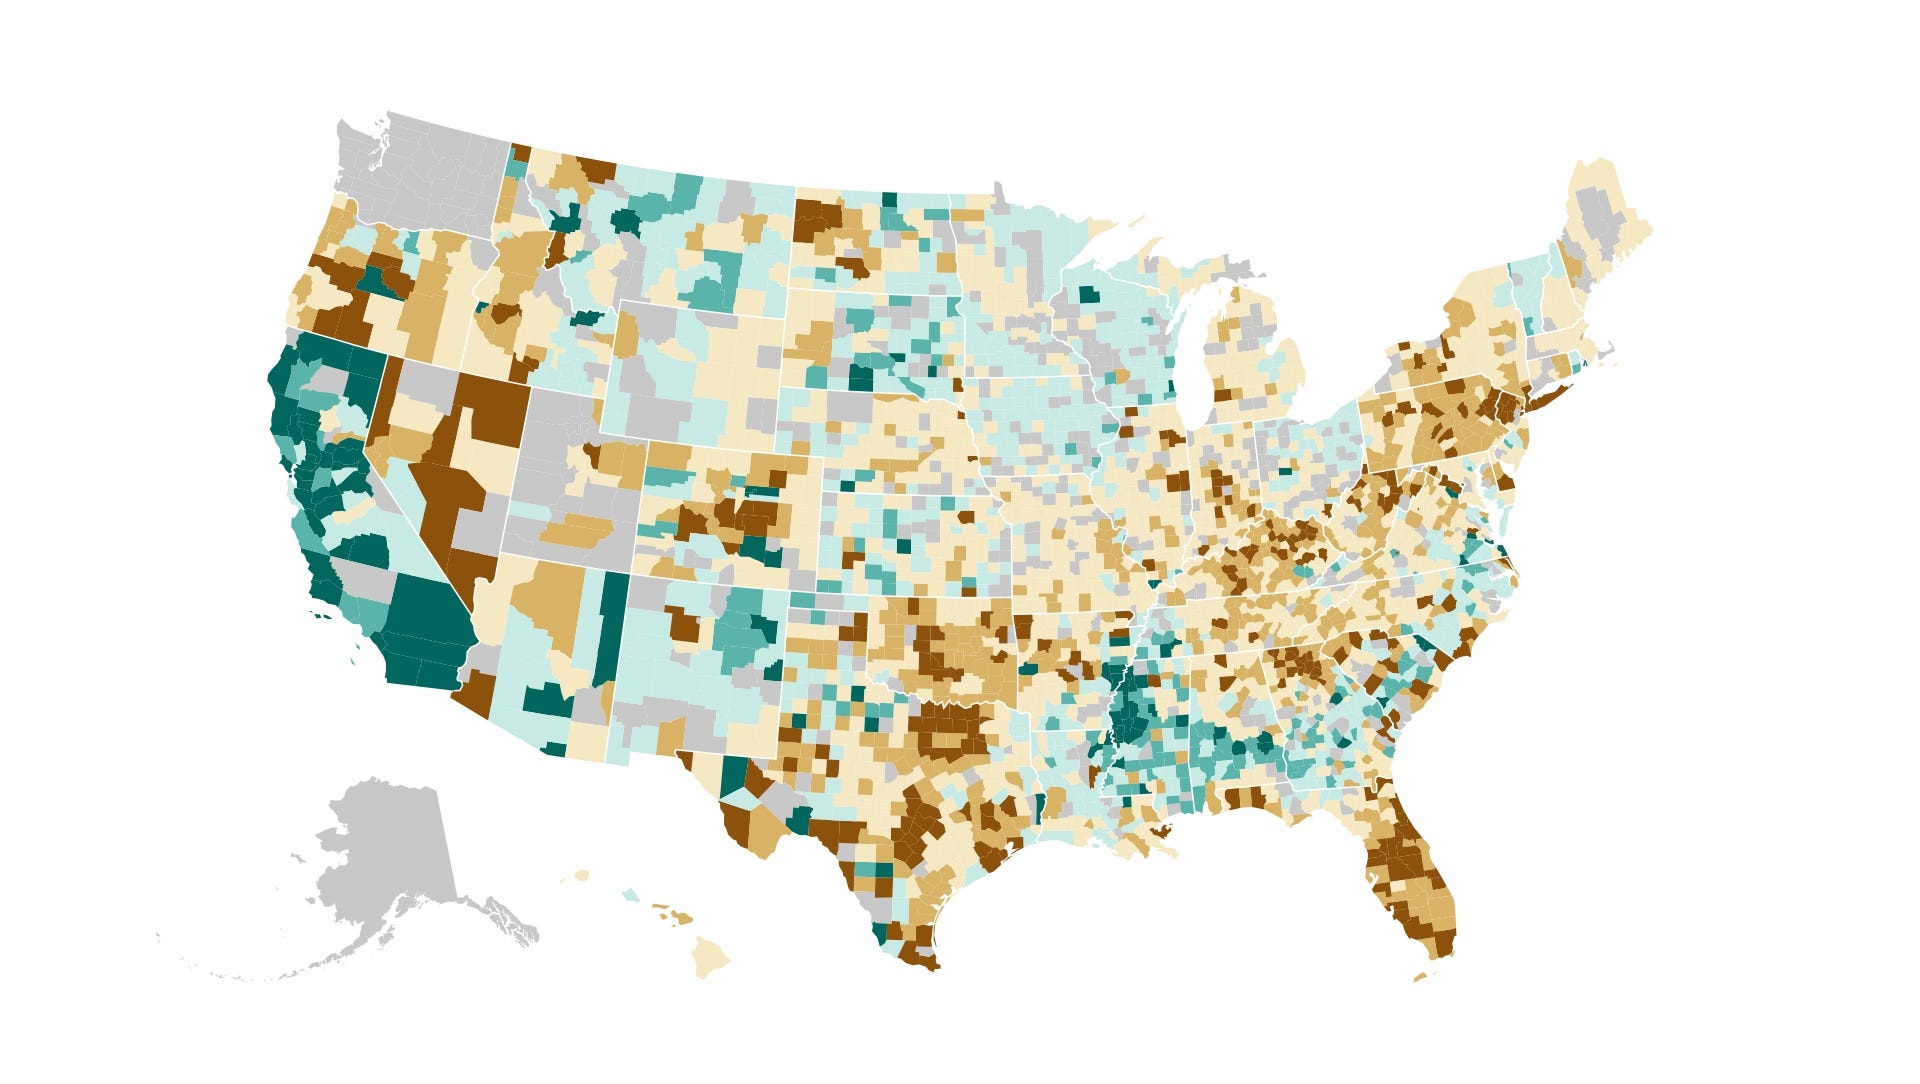
Percent change in voter turnout:
< -10% – Dark Green
-5% — -10% – Green
0% — -5% – Light Green
No result – Gray
0% — 5% – Biege
5% — 10% – Tan
10%+ – Brown
Source: Associated Press, as of 4:30pm EST, Note: Alaska does not report county-level results.
Fewer Hispanics supported Clinton
Percentage of Hispanic voter support going to Democratic presidential candidates:

The education gap
Exit polls revealed a nation deeply divided. Men and those without a college education went strongly for Trump. Women and those who had a degree backed Clinton.

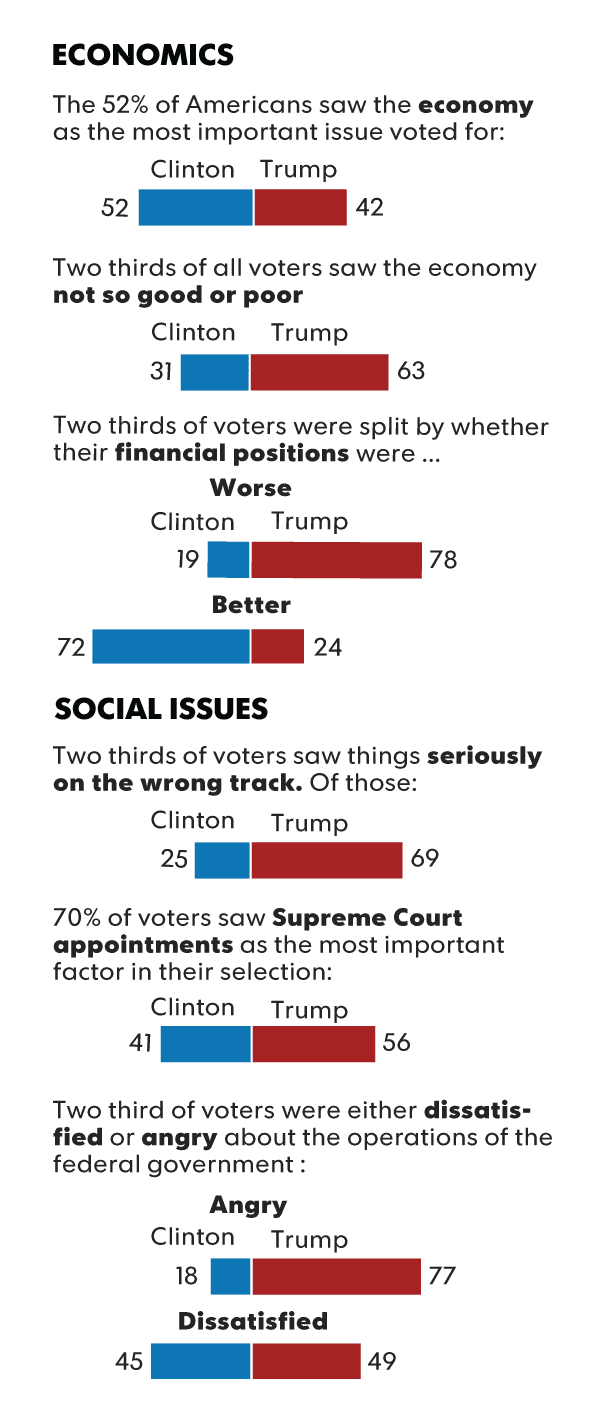
EXIT POLLS
What drove their votes
It wasn’t the economy that drove voters’ decision this year. Instead, it was distaste — and often anger — at the way the fed- eral government is doing its job, and a deep sense that the USA is headed in the wrong direction. That was enough for voters to throw their support behind a first-time candidate who many of his sup- porters said they did not like or trust, or who they judged unfit to hold the office.
SOURCE: AP, U.S. Census Bureau and the National Election Pool Survey by Edison Research.
Related Posts
 Native American Scientists Build Bridges Between Ancient Culture and High-Tech World
 Pervs, Politicos and Prey: Ethnic Media and the Problem of “Hack Marketing”
 College-readiness not keeping up in California
  Native American voices are finally factoring into energy projects – a hydropower ruling is a victory for environmental justice on tribal lands
- Obama’s remarks on race resonate with many