By Abby Budiman, Anthony Cilluffo and Neil G. Ruiz
Pew Research Center, May 22, 2019.
Asian Americans are the fastest-growing major racial or ethnic group in the United States. More than 20 million Asians live in the U.S., and almost all trace their roots to 19 origin groups from East Asia, Southeast Asia and the Indian subcontinent, according to a Pew Research Center analysis of U.S. Census Bureau data.
Significant differences exist by income, education and other characteristics among the nation’s largest 19 Asian origin groups. These differences have been central to debates about how much data governments, colleges and other groups should collect about Asian origin groups, and whether it should be used to shape policies.

Here are some key differences between Asian origin groups in the U.S. and how they compare with Asian Americans overall.
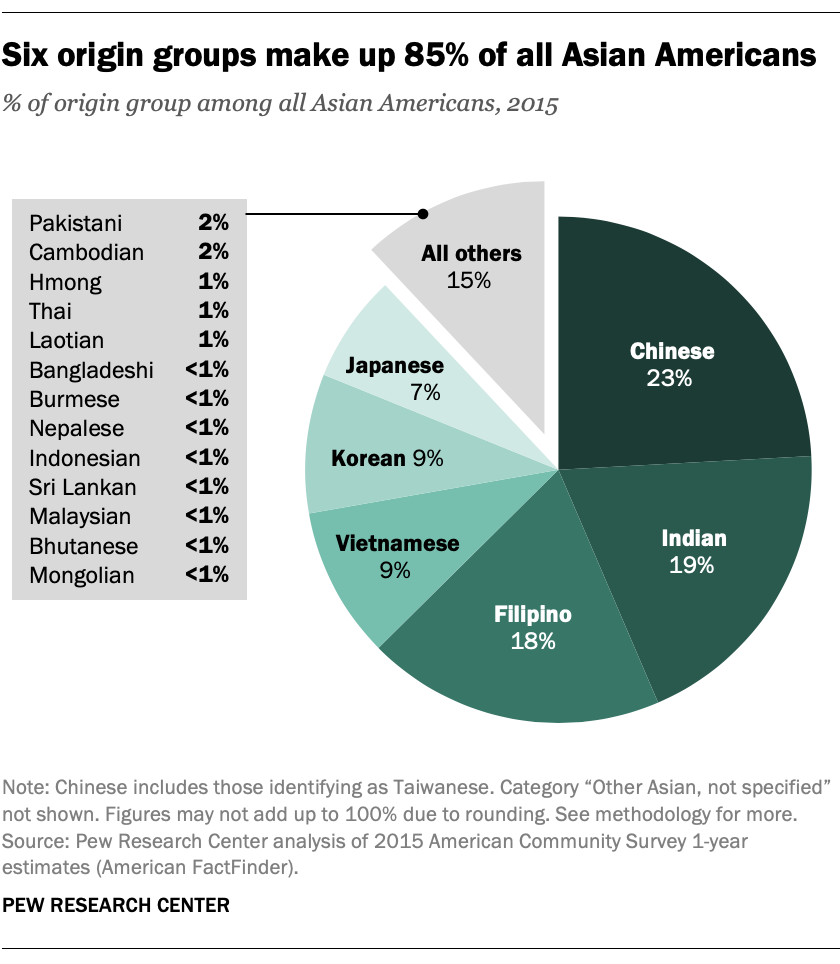
1. Six origin groups – Chinese, Indian, Filipino, Vietnamese, Korean and Japanese – accounted for 85% of all Asian Americans as of 2015.
These groups together largely shape the overall demographic characteristics of Asian Americans. The remaining 13 origin groups each made up 2% or less of the nation’s Asian population. These groups have a variety of characteristics that can differ greatly from the largest groups.
2. About half of Asians in the U.S. ages 25 and older had a bachelor’s degree or more in 2015, a higher share than other races and ethnicities, but this share varies greatly by origin group.
Those of Indian, Malaysian or Mongolian origin, for example, were more likely than other Asian origin groups to have at least a bachelor’s degree. By comparison, fewer than 20% of Cambodians, Hmong, Laotians and Bhutanese had a bachelor’s degree or more. Roughly a third of all Americans ages 25 and older had a bachelor’s degree or more.
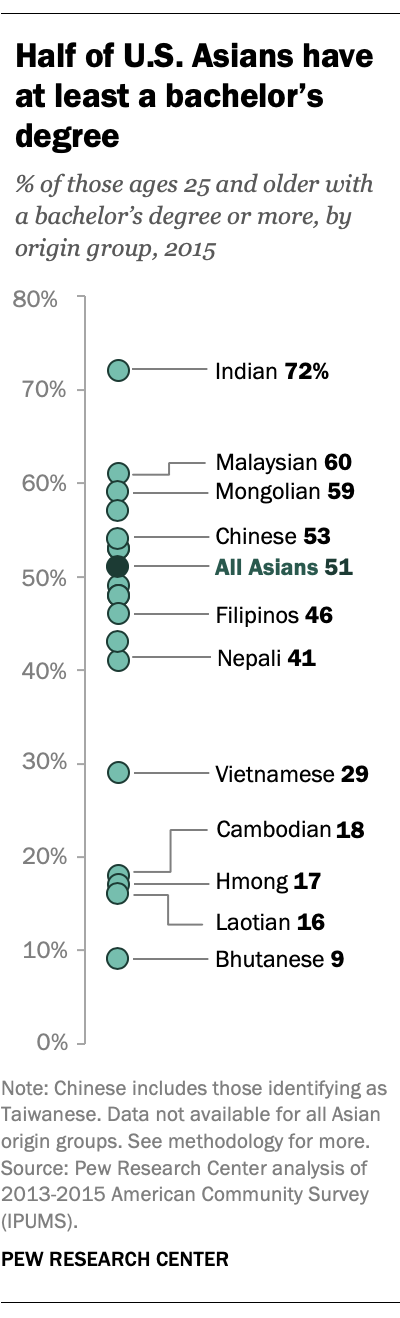
The differences in educational attainment among origin groups in part reflect the levels of education immigrants bring to the U.S. For example, 72% of U.S. Indians had a bachelor’s degree or higher in 2015. Many of them already had a bachelor’s degree when they arrived in the U.S. with a visa for high-skilled workers, such as an H-1B visa. Half of H-1B visas, which require a bachelor’s degree or equivalent, have gone to Indians since 2001.
3. Seven-in-ten U.S. Asians ages 5 and older speak English proficiently.
Large majorities of Japanese (84%), Filipinos (82%) and Indians (80%) spoke English proficiently in 2015. By contrast, Bhutanese (27%) and Burmese (28%) had some of the lowest rates of English proficiency.
4. Income inequality is rising more rapidly among Asian Americans than other racial or ethnic groups, reflecting wide disparities in income among Asian origin groups.
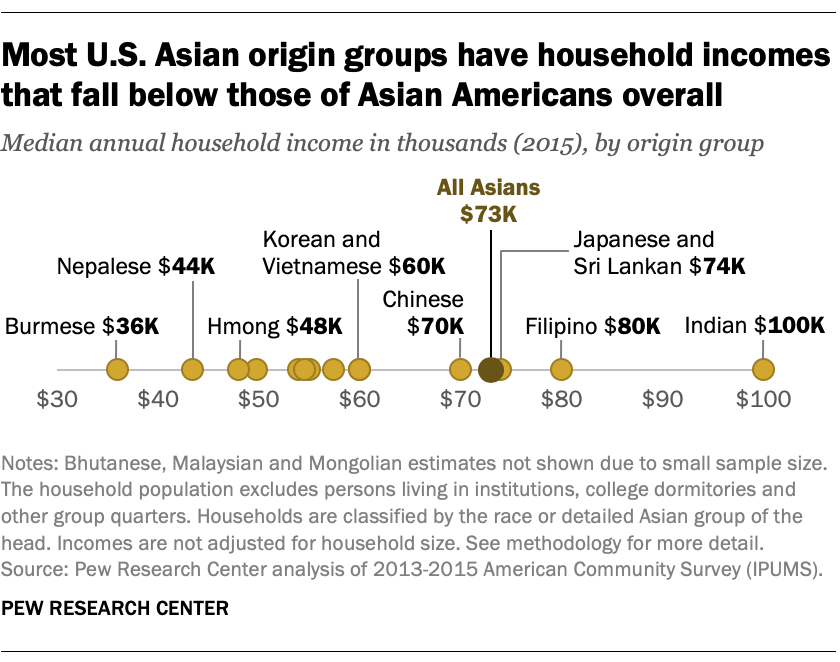
Asian households in the U.S. had a median annual income of $73,060 in 2015, higher than the $53,600 among all U.S. households. Only four Asian origin groups had household incomes that exceeded the national median for Asian Americans overall: Indians ($100,000), Filipinos ($80,000) and Sri Lankans and Japanese (both $74,000). By contrast, most of the other 15 origin groups were well below the national median for Asian Americans, including the two with the lowest median household incomes – Nepalese ($43,500) and Burmese ($36,000).
5. As with education and income, poverty rates vary widely among Asians in the U.S.
Asians overall had a poverty rate of 12.1% in 2015, 3 percentage points lower than the U.S. poverty rate (15.1%). Bhutanese (33.3%) and Burmese (35.0%) had the highest poverty rates among all Asian origin groups – more than twice the national average and more than four times the poverty rates among Filipinos and Indians (both 7.5%).
6. Immigrants make up a higher share of some Asian origin groups than others.
Among all Asians in the U.S., nearly six-in-ten were foreign born in 2015, significantly larger than the immigrant share among Americans overall (13%) and other racial and ethnic groups that same year.
Some Asian groups arrived as immigrants more recently than others. For instance, 85% of Burmese in the U.S. are foreign born, and many of them arrived as refugees starting in 2007. Eight-in-ten Burmese immigrants (81%) have been in the country for 10 years or less.
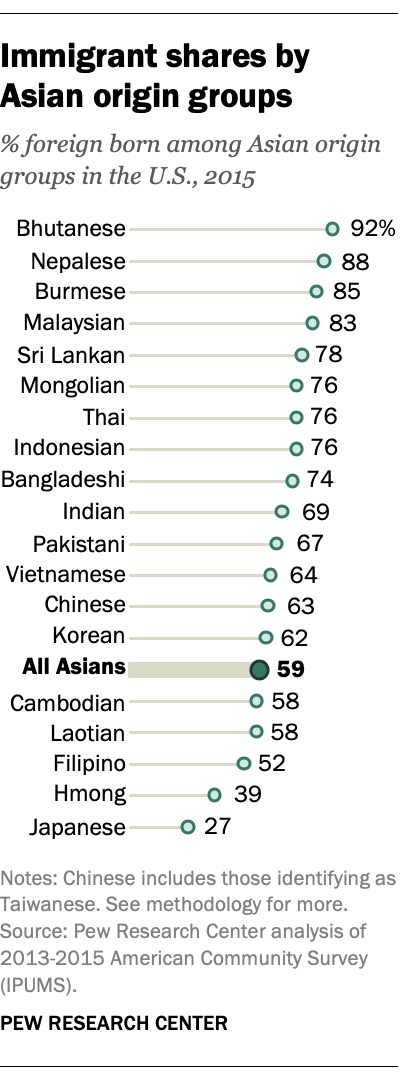
But not all U.S. Asian groups have high foreign-born shares. For instance, the first Japanese immigrants came to the U.S. in the 19th century as plantation workers in what is now the state of Hawaii. More recently, fewer Japanese immigrants have arrived to the U.S. compared with other Asian origin groups. This history is reflected in the low share of Japanese Americans who are immigrants (27%). Additionally, among Japanese immigrants, two-thirds (64%) have been in the country for more than 10 years.
7. Among Asian immigrants, 58% have become U.S. citizens, though naturalization rates vary widely.
Nearly eight-in-ten Hmong and Vietnamese immigrants are U.S. citizens (77% and 75%), the highest shares among U.S. Asian groups. Differences in naturalization rates reflect how long immigrants have lived in the U.S. Large numbers of Vietnamese and Hmong arrived in the U.S. as refugees starting in the 1970s and have had more time to naturalize. By contrast, many Bhutanese have arrived in the U.S. as refugees starting in 2008 (98% of Bhutanese immigrants have been in the U.S. for 10 years or less) and only 6% have naturalized, the lowest share of any group.
For more information on Asians in the U.S., see Pew Research Center’s detailed fact sheets for each national origin group and the methodology for the analysis.