
Asian American wealth inequality is greater and rising faster than white wealth inequality.
By Christian E. Weller and Jeffrey Thompson
Center for American Progress, December 20, 2016 —

Teacher Thao Tran helps students learn fish anatomy in a Vietnamese immersion class at White Center Heights Elementary School in Seattle on February 14, 2014. (AP/Elaine Thompson)
Introduction and summary
The narrative of this year’s U.S. presidential election made clear that Americans are acutely concerned about the widening income inequality in the United States. The distribution of wealth among American households, however, has been far less studied yet is just as concerning. Whereas income mainly consists of money people earn at work, wealth is defined as the difference between savings—such as bank accounts, retirement accounts, and housing—and debt. Economists have found that wealth is even more unequally distributed than income in the United States.
One particularly understudied aspect of wealth inequality is the distribution of wealth between and among whites and Asian Americans,1 the fastest growing racial group in the United States. In 2013, the last year for which complete data are available, Asian Americans represented a little more than 5 percent of the nation’s population and have grown faster than any other population group between 2000 and 2013.2 Compared with other ethnic groups, Asian Americans tend to have higher incomes than other communities of color.3 These higher incomes among Asian Americans have occasionally led to the popular view of Asian Americans as economically more advantaged than other groups.4 This notion, however, ignores the high degree of economic inequality of Asian Americans—inequality that is reflected in the data on wealth. Wealth among Asian Americans is highly concentrated, and many Asian Americans, especially Asian American seniors who need to live off of their savings, live in an economically precarious situation.5 Consequently, too many Asian Americans are far away from a secure retirement and ill-prepared to weather an emergency.
This report contributes to the growing number of studies of the economic well-being of Asian Americans, showing that wealth inequality among Asian Americans is far greater than the already high wealth inequality among whites.6 Although many Asian Americans have wealth comparable to that of whites, a large share of Asian Americans have little or no wealth. Focusing only on average or median wealth of Asian Americans can thus be misleading because doing so ignores a large share of Asian Americans who continue to struggle economically.
Wealth, after all, is a key indicator of people’s economic security. Wealth or savings allow people to weather unexpected events such as a layoff or illness and plan for the future—for example, sending children to college, starting a business, taking on a new job, and retiring. Put differently, those without wealth or with only little savings are in an economically precarious situation with respect to their future.
If the past few decades are any indication, the economic future remains uncertain and people need more savings. As economic risks such as unemployment, income drops, and unexpected caregiving demands have increased, more short-term savings help people make it through.7
People also need to save more to pay for education and retirement. College tuitions have regularly outpaced inflation, driving students deeper into debt absent their own or their families’ savings.8 And the costs of retirement keep going up as well. The normal retirement age to receive full Social Security benefits is rising from age 65 to age 67. Defined benefit pensions continue to disappear. Health insurance costs generally outpace incomes, and many people are simply living longer than those in previous generations. People today need to have more savings available to them just to maintain the same standard of living.9
Yet many people have only some or even no wealth, while others have amassed substantial amounts. Wealth inequality is typically much larger than income inequality.10 As a rule, those who struggle economically today also tend to face uncertain futures. Moreover, the gap between those who have a lot of wealth and face a secure future and those who do not keeps growing.11
Increasing wealth inequality, however, is not just about numbers. An unequal wealth distribution means that many people face economic uncertainties on a day-to-day basis because they cannot cover an emergency such as a layoff. It also means that many people cannot, for example, send their kids to the college of their choice, start and grow a business, or move to a new job and/or career.
Differences in wealth are especially stark by race. African Americans and Latinos tend to have a lot less wealth than whites.12 This wealth gap has persisted as economic mobility and the ability to save has gone down for many people, especially African Americans and Latinos.
Asian Americans, in comparison, are often heralded as the exception.13 Their wealth on average and at the median tends to be comparable to that of whites—at least in the years since the Great Recession ended in 2009. This view, though, is somewhat narrow as it overlooks the fact that the economic experience of Asian Americans tends to be more varied than that of whites.14 For instance, Asian Americans have higher family incomes than is the case for whites—$76,761 compared to $62,950 in 2015—but their poverty rate is also higher, at 11.4 percent compared to 9.1 percent in 2015. Asian Americans are not only the fastest growing racial group in the United States, they are also economically one of the most diverse groups, with a substantial share of Asian Americans struggling day to day.
Considering that this pattern of economic disparity in Asian American communities is not new, it is also no surprise to find substantial wealth inequality among Asian Americans. The data in this report specifically show that:
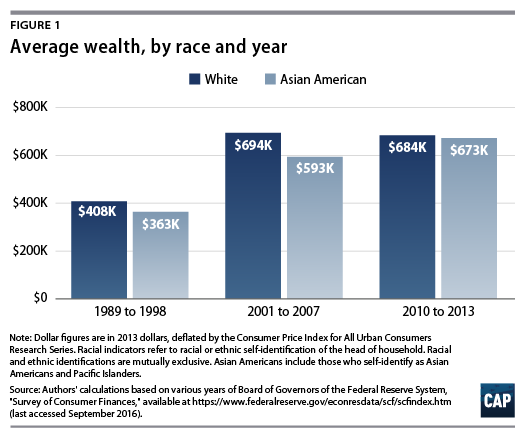
– Asian American average and median wealth has become comparable to white wealth.
– Asian Americans at the bottom of the income distribution have less wealth than whites at the bottom of the income distribution.
– Wealthy Asian Americans have more wealth than wealthy whites.
– Wealth inequality among Asian Americans is greater than among whites.
– Wealth inequality among Asian Americans has widened over time.
– Asian Americans have fewer retirement benefits than whites.
– Asian Americans have lower homeownership rates than whites.
– Asian Americans owe more debt than whites.
The data on Asian American wealth are a mix of good news and bad news. Asian American wealth has been trending up, catching up to wealth levels for whites on average. But many Asian Americans are left behind with no or very little wealth. Although the data in this report do not allow for a further disaggregation by subpopulations, other data on employment and wages, for instance, suggest that some subpopulations such as Vietnamese-Americans are economically more vulnerable than other groups of Asian Americans.15 It is thus reasonable to assume that these same subpopulations make up a disproportionate share of Asian Americans with little wealth. Moreover, the gap between wealthy and nonwealthy Asian Americans has widened. Asian Americans also have fewer retirement benefits than whites and are more indebted than whites, creating a potentially precarious situation when stock and housing prices fall. The bottom line is that wealth inequality across American families deserves policy attention. This is especially true for Asian Americans in the bottom half of the income distribution.
Average and median Asian American wealth resembles white wealth
Household wealth is the difference between assets that can be turned into income when people need the money and debt that they owe. Wealth is then a safety net for emergencies and a means to pay for big ticket items, such as children’s college education, a down payment for a house, and the start-up costs of a new business; it is also a way to supplement retirement income from Social Security. The gap between those with a lot of wealth and those at the bottom of the income distribution, however, is much larger than comparable income gaps, which have also grown over the past three decades.
To some degree, slow income growth and modest wealth are related. Stagnant income growth for many middle-class families over the past few decades has meant that families have often had to focus on paying rising bills for housing, health care, and education, which has left little room to save.16 Saving got even more difficult during this time as the labor, stock, and housing markets became more volatile, often decimating people’s savings.17 Furthermore, employers cut back on retirement benefits for their employees, thus pulling away the extra help that people could have used to save during increasingly insecure times.18
Not all people are equally affected by these adverse effects. African Americans and Latinos, for instance, tend to be economically more vulnerable than whites.
Asian Americans are often held up as counterexamples of shrinking racial wealth gaps by pointing to their average or median incomes. The use of averages or even medians, though, obscures the fact that the Asian American community is economically very diverse. A large number of Asian Americans indeed fare comparatively well, while a large minority of Asian Americans struggles immensely, often more so than other racial and ethnic minorities.
The summary of existing wealth data shows that at sufficiently high levels of data aggregations, Asian American wealth mirrors that of whites. Average Asian American wealth, for instance, has gradually pulled to par with white wealth in recent years. (see Figure 1) Median Asian American wealth, as summarized in the Appendix, has also become relatively close to median white wealth. (see Appendix for detailed summary tables)
Wealth inequality is larger for Asian Americans than for whites
Looking only at average and median wealth for all Asian Americans obscures the fact that wealth is unequally distributed. The bottom one-fifth of households in the Asian American wealth distribution, for instance, had at most $9,319 in 2010–2013. That is, the median Asian American household had more than 14.3 times the wealth of the bottom 20 percent of households. Meanwhile, the top 10 percent of households in the Asian American wealth distribution had more than $1.4 million in 2010–2013. Asian Americans at the 90th percentile—where the top 10 percent of wealthy Asian Americans starts—then had 168.4 times the wealth of the top of the bottom 20 percent—$1,448,118 compared to $9,319—in 2010–2013. (see Table 1)
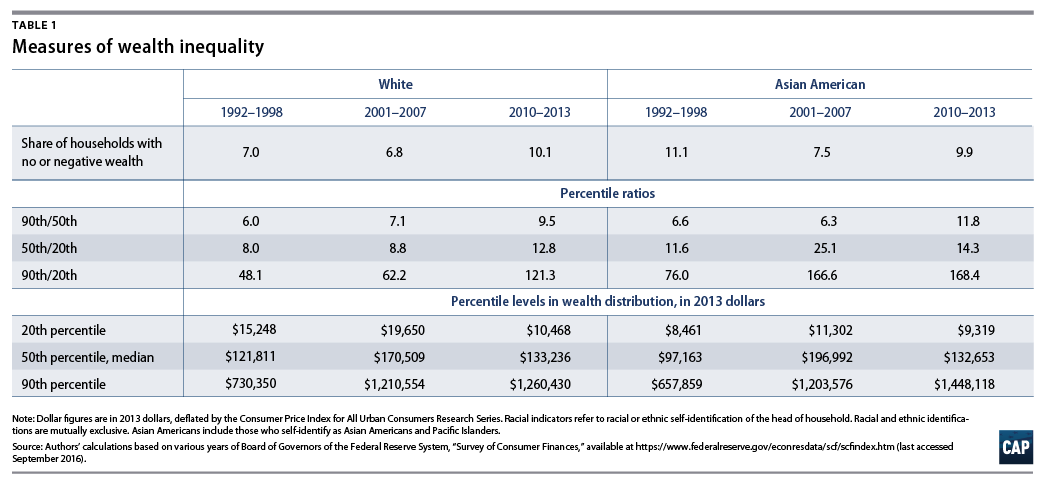
Wealth inequality among Asian Americans in fact is greater than that among whites. The ratio between median wealth and wealth at the 20th percentile for whites was 12.8—$133,236 compared to $10,468—lower than the comparable ratio of 14.3 for Asian Americans. Moreover, white households at the 90th percentile—the top 10 percent—had 121.3 times the wealth of households at the bottom 20th percentile—$1,260,430 to $10,468 in 2010–2013. This is significantly smaller than the comparable ratio of 168.4 for Asian Americans. (see Table 1) Wealth inequality among Asian Americans was greater in 2010–2013 than among whites because nonwealthy Asian Americans had less wealth than nonwealthy whites and because wealthy Asian Americans had more wealth than wealthy whites.
The lack of wealth among poorer Asian Americans is particularly disconcerting. The median wealth for Asian Americans in the bottom half of the income distribution was $18,270 in 2010–2013. This is much lower than the $42,238 median wealth recorded for whites in the bottom half of the income distribution. (see Table A1 in the Appendix) That is, whites in the bottom half of the income distribution had more than twice the wealth of Asian Americans in the bottom half of the income distribution.
Asian American wealth inequality has increased
Asian American wealth inequality has grown over time. Middle-class Asian Americans at the median had 6.6 times the wealth of Asian Americans at the 20th percentile—$97,163 to $8,461—between 1992 and 1998. This ratio increased to 11.8 in 2010–2013. Similarly, Asian American wealth at the 90th percentile was 76.0 times the wealth at the 20th percentile in 1992–1998. This ratio increased to 168.4 in 2010–2013. (see Table 1)
These data signal that wealth has grown faster among wealthy Asian Americans than among middle-class Asian Americans. And middle-class Asian Americans saw faster wealth increases from the early years—1992 to 1998—to the later years—2010 to 2013—than was the case for Asian Americans with little wealth at the 20th percentile of the wealth distribution. Wealth among Asian Americans at the 90th percentile grew by 120.1 percent—it more than doubled—while it grew by 36.4 percent at the median and by only 10.1 percent at the 20th percentile, from the early to the later years. (see Figure 2)

These trends are different from those for whites, largely because wealth at the three percentile levels grew for Asian Americans from 1992–1998 to 2010–2013. White wealth, on the other hand, fell at the 20 percentile, from $15,248 during the early years—1992 to 1998—to $10,468 in the later years—2010 to 2013. (see Table 1) Median white wealth increased by less than 10 percent, and white wealth at the 90th percentile less than doubled during this time period. (see Table 1) That is, wealth inequality among whites increased in large part because wealth declined among less-wealthy whites, although they still had more wealth in 2010–2013 than was the case for less-wealthy Asian Americans.
Asian American wealth inequality follows from lower homeownership and pension coverage
Asian American wealth looks different from that of whites, when considering its components—assets and debt—individually. The data in particular show some noteworthy differences in the assets between Asian Americans and whites. In 2010–2013, Asian Americans had more assets—$287,306—than whites—$237,401. Yet Asian Americans in the bottom half of the income distribution had much less in assets—$40,503—than whites in the bottom of the income distribution, who owned $91,942 in assets during that time. (see Table 2) That is, assets are more unequally distributed among Asian Americans than among whites.
This greater wealth inequality follows from a more unequal distribution of housing assets—lower homeownership—among Asian Americans than is the case for whites.19 Houses typically constitute the largest asset for households. The data show that Asian Americans are less likely to be homeowners than whites. Less than three-fifths of Asian Americans—59.6 percent, to be exact—were homeowners in 2010–2013. In comparison, the homeownership rate for whites in the wake of the Great Recession was 73.9 percent. (see Table 2)
Lower rates of homeownership among Asian Americans can have serious implications for people’s economic security. Homeownership can contribute to more stable communities, better educational outcomes, and more civic engagement. These factors together help create more wealth for homeowners, suggesting that lower homeownership rates can result in rising wealth inequality within certain communities.

The homeownership gap between Asian Americans and whites in fact widened a little following the Great Recession. The homeownership rate for Asian Americans dropped by almost 2 percent, from 61.5 percent in 2001–2007 to 59.6 percent in 2010–2013. At the same time, the white homeownership rate only dropped by 1 percent, from 74.9 percent in the 2000s to 73.9 percent in 2010–2013. (see Table 2) The housing crisis associated with the Great Recession apparently hurt Asian Americans more than it did whites.
Behind homeownership, the second-most widely held asset among U.S. households is retirement savings. People can expect to receive retirement income from defined benefit, or DB, pensions, which thus constitute an asset to households. DB pensions typically pay out a monthly income during retirement as long as retirees are alive, rather than giving workers a lump sum when they retire. Additionally, people save for retirement with retirement savings accounts such as 401(k) plans and individual retirement accounts, or IRAs.
The data again show that Asian Americans lag behind whites with respect to retirement savings, largely because they are much less likely to have a DB pension. Only 15.5 percent of Asian Americans could expect a DB pension in 2010–2013, compared to 35.4 percent of whites. DB pension coverage has declined in general, but faster for Asian Americans than for whites. The share of Asian Americans with a DB pension dropped from 24.6 percent in the 1990s to 15.5 percent in the years after the Great Recession—a decrease of 9.1 percent. At the same time, the share of whites with a DB pension fell from 39.7 percent to 35.4 percent—a decline equal to 4.3 percent, or less than half the rate of decline among Asian Americans. (see Table 2)
The much lower DB pension coverage among Asian Americans is not offset by much more widespread retirement savings accounts. In 2010–2013, 58.1 percent of Asian Americans had a retirement savings account with a median balance of $67,025. In comparison, 56.6 percent of whites had retirement savings accounts with a median balance of $65,949. (see Table 2)
Finally, Asian American households in the lower half of the income distribution are less likely to be homeowners, to have a DB pension, and to have money in retirement savings accounts than is the case for Asian Americans overall. Moreover, Asian American households in the bottom of the income distribution look relatively similar to whites in the bottom of the income distribution, except that they are much less likely to be homeowners. (see Table 2)
Some of the differences in retirement wealth and homeownership are also due, at least in part, to differences in the age composition and residential distribution of white and Asian American households. Asian American households are considerably younger, on average, than white households. (see Table A4 in the Appendix) Younger households are less likely to be homeowners, more likely to be in jobs without DB pensions, and tend to have had fewer years to accumulate pension wealth of any kind. Moreover, Asian American households are heavily concentrated in urban areas with larger renting populations, a factor which also likely contributes to their lower homeownership rates.
Asian Americans owe larger mortgages than whites
Debt is the other side of the wealth equation. Generally speaking, Asian Americans are less indebted than is the case for whites, although the differences are often comparatively small. (see Table A3 in Appendix) However, the data show some notable differences—for instance, with respect to mortgages.
Mortgages are the most widespread and largest form of debt for all households. Asian Americans are no exception. Close to half—46.1 percent—of Asian Americans owed money on a mortgage or home equity loan in 2010–2013. This is similar to the 49.7 percent of whites who owed money on a mortgage or home equity line. But the amounts owed on mortgages are quite different between Asian Americans and whites; Asian Americans homebuyers owed a median amount of $236,011 in mortgages in 2010–2013, while whites owed $118,515 during the same time. (see Table 3) This is consistent with Asian Americans being concentrated in high-priced housing markets on the East Coast and West Coast.20 As a result, Asian Americans tend to spend a disproportionate amount of their income on housing. The concomitant heavy mortgage indebtedness leaves many Asian Americans more vulnerable to potential house price declines than is the case for whites.

Notably, the data suggest that mortgages are more equally distributed among Asian Americans than among whites; this means that debt exacerbates wealth inequality relative to the distribution of assets among Asian Americans. The share of households with mortgages in the bottom half of the income distributions for Asian Americans and whites are somewhat similar—24.3 percent compared to 29.5 percent in 2010–2013. But the median amounts of mortgages are again much larger for Asian Americans—at $118,056—than for whites, who owed only $72,009 at the same time. (see Table 3) Mortgage debt is larger for Asian Americans across the board, offsetting higher asset values among wealthier Asian Americans and drawing down wealth for poorer Asian Americans. Wealth inequality among Asian Americans is linked to homeownership and the related mortgages. Higher levels of mortgage debt are influenced by living in higher cost-of-living regions, which is more common among Asian American households.
More mortgage debt can also increase the financial vulnerability of homeowners. Being deeper in mortgage debt can increase the chance of foreclosure. It is therefore not surprising that some Asian American groups, specifically Indian-, Korean-, and Vietnamese-Americans in Orlando and Phoenix—areas where the financial crisis hit especially hard—had foreclosure rates in 2010 that were much higher than those of non-Hispanic whites.21
Student and car loans rising faster among Asian Americans than among whites
Although far smaller than mortgage debt, the share of installment loans—mainly student debt and car loans—among Asian Americans also deserves attention. Student debt and car loans have risen to their highest nationwide level on record dating back to 1968.22 And student and car loans tend to be more expensive than mortgages, disproportionately burdening those with such debt. Increases in student loans tend to be especially pronounced for African Americans and Latinos.23 Meanwhile, the median amounts that Asian Americans owe on their installment loans were comparable with those that whites owed—$15,258 for Asian Americans compared to $15,021 for whites—in 2010– 2013. (see Table 3) And median installment debt levels are also roughly similar for low-income Asian Americans and whites.
Although the debt owed on installment loans is largely comparable among white and Asian American populations, the data in Table 3 notably show that installment loans have risen substantially faster among Asian Americans than among whites. These data reflect similar trends for other communities of color. In 2010–2013, 41.1 percent of Asian Americans had installment loans, up from 36.3 percent in 1992–1998. This is an increase of 4.8 percent. In comparison, the share of whites with installment loans grew by only 0.9 percent, from 46.3 percent in 1992–1998 to 47.2 percent in 2010–2013.
The installment loan increases among lower-income Asian Americans are especially noteworthy. The chance of having installment debt was 37.7 percent among Asian Americans in the bottom half of the income distribution in 2010–2013. This was close to the 40.3 percent of whites with installment loans in 2010–2013 and up from 34.3 percent in 1992–1998. (see Table 3) Put differently, lower-income Asian Americans are getting deeper into costly debt.
Recommendations and conclusion
The data suggest that wealth inequality is larger among Asian Americans than among whites. Thoroughly identifying the reasons behind these differences is beyond the scope of this report, but it is most likely a combination of demographic differences, such as the age composition and geographic distributions mentioned above, and economic factors, such as access to quality employment with benefits and high wages. The fact that the typical Asian American household has a higher level of educational attainment and lower wealth than the typical white household suggests that the differences are not simply limited to age and region. Rather, these differences reflect widespread and longer-term inequality among other economic indicators—such as jobs, wages, and benefits—between Asian American subgroups. The fact remains that a substantial share of low-income and middle-class Asian Americans has a lot less wealth than similarly situated whites.
Wealth inequality among Asian Americans has also grown faster for the past two decades than it has for whites. In part, this rise in wealth inequality can be traced back to greater indebtedness and faster rising debt, especially installment loans for student debt and car purchases. The faster rise in inequality among Asian Americans than among whites in particular suggests that Asian American inequality results from factors other than just age and education.24
The economic inequality among Asian Americans has long been recognized, but the data to support this case are often missing. Publicly available wealth data from the Survey of Consumer Finances, for instance, do not include household data on whether heads of household self-identify as Asian American. Moreover, researchers often include separate data for Pacific Islanders and/or Native Americans as comparison points to data for Asian Americans.25 But the wealth data used in this report include too few observations to parse out wealth for Pacific Islanders and Native Americans.
The data thus lead to several clear policy conclusions. First, it is critical to systematically collect and disseminate data on Asian Americans, Pacific Islanders, and relevant subgroups. The Asian American community is the fastest growing racial group in the country. Policymakers cannot adequately address the needs of this population without good data.
The available data, though, suggest that a large share of Asian Americans are in need of effective wealth-building policies. This can mean more efficient policy interventions to boost savings. Congress, for instance, could make the existing Saver’s Credit for retirement savings refundable so that even households living below the federal poverty line with little or no federal income tax payments can take advantage of it.26 It can also mean more access to retirement savings for workers whose employer does not offer retirement benefits. State governments, for instance, are looking at offering new, low-cost, low-risk retirement savings options to private-sector workers who do not have retirement benefits at work. Similar proposals exist at the federal level to give private-sector workers more access to decent retirement savings.
Policymakers could also boost wealth by cutting people’s debt. This could happen by lowering the need for people to borrow—for instance, by cutting the costs of a college education. People’s debt would also rise more slowly if associated fees—for instance, for car title loans—were lower.
The bottom line is that policymakers have a range of options available to address the persistent and widening wealth inequality and associated economic insecurity for many Asian Americans. Creating more economic security and opportunity for all Americans, including large swaths of Asian Americans, is only a matter of political will.
About the authors
Christian E. Weller is a professor of public policy at the University of Massachusetts Boston and a Senior Fellow at Center for American Progress.
Jeffrey P. Thompson is principal economist at the Board of Governors of the Federal Reserve System.
Acknowledgments
The authors would like to express their gratitude to Peter Hansen and Jamal Hagler for their outstanding research assistance. The authors are also grateful to Karthick Ramakrishnan for insightful and helpful comments.
The analysis and conclusions set forth are those of the authors and do not indicate concurrence by other members of the research staff or the Board of Governors.
Appendix
Data and methodologies
The authors of this report used data from the nine waves of the Federal Reserve Board’s triennial Survey of Consumer Finances, or SCF, conducted from 1989 to 2013. Several features of the SCF make it appropriate for informing the question of racial wealth gaps. The survey collects detailed information about households’ financial assets and liabilities and has employed a consistent design and sample frame since 1989.27 As a survey of household finances and wealth, the SCF includes some assets that are broadly shared across the population, such as bank savings accounts, as well some that are held more narrowly and that are concentrated in the tails of the distribution, such as direct ownership of bonds.
To support estimates of a variety of financial characteristics, as well as the overall distribution of wealth, the survey employs a dual-frame sample design. A national area probability sample provides good coverage of widely spread characteristics. The area probability sample selects household units with equal probability from primary sampling units that are selected through a multistage selection procedure, which includes stratification by a variety of characteristics and selection proportional to their population.
Because of the concentration of assets and nonrandom survey response by wealth, the SCF also employs a list sample developed from statistical records that are derived from tax returns under an agreement with the IRS’s Statistics of Income program.28 This list sample consists of households with a high probability of having high net worth. The SCF joins the observations from the area probability and list sample through weighting. The weighting design adjusts each sample separately using all of the useful information that can be brought to bear in creating post-strata. The final weights are adjusted so that the combined sample is nationally representative of the population and assets.29 These weights were used in all figures presented in this paper.
The key variables discussed in this paper are net worth and a variety of classes of assets and debt.30 Total assets include the value of all financial and nonfinancial assets, including residential and nonresidential real estate and owned businesses, reported by the respondent at the time of the interview. Total debt reflects all types of debt, including credit cards, mortgage debt, student loans, business debts, and other miscellaneous forms of debt.
The unit of analysis in the SCF is the “primary economic unit,” which refers to a financially dependent group of people who are living together and are related by blood, marriage, or domestic union. This concept is distinct from either the household or family units employed by the U.S. Census Bureau but is conceptually closer to the latter, and throughout this paper, primary economic units are referred to as “families.” Single individuals living alone are included and simply considered a family of one.
In addition to household finances, the SCF also collects some basic demographic information, primarily for the head of household. The survey collects the self-identified race of the head of household and allows respondents to choose from seven options. The exact wording of the telephone version of the survey is as follows: “Which of these categories do you feel best describe you: white, black or African American, Hispanic or Latino, Asian, American Indian or Alaska Native, Hawaiian Native or other Pacific Islander, or another race?”
Prior to 1998, respondents were only allowed to choose a single category. Starting in 1998 respondents were allowed to give multiple responses, but they were asked to give first the category they identified with most strongly. The variable in the public version of the SCF is based on the first answer provided. Few people give more than one response. Beginning in 2004, respondents were also asked a question to determine whether they were of Hispanic/Latino culture or origin, regardless of race.
For the analysis in this paper, the authors used the race variable as presented in the data—reflecting the first option chosen in 1998 and thereafter—and ignoring any complications potentially related to the race variable changes in 1998 that allowed for the selection of multiple races and in 2004 when a separate identification of Hispanic ethnicity was included. Over the entire 1989–2013 period, 74 percent of households were classified as white by virtue of having a white head of household, 13 percent as black, and 9 percent as Hispanic. Of the remaining 4 percent of households, the single largest group was Asian.
There are too few Asian American households surveyed in any individual year of the SCF to support reliable statistics. By grouping several years together, however, there is a large enough number of Asian American households to calculate reliable measures of wealth, assets, and debt. Because the SCF sample size has increased over time, starting at just 3,100 in 1989 and rising to more than 6,000 by 2013, and the Asian population has grown, the authors combined three or four earlier survey years and just two years more recently.
Additional tables


Endnotes
1. Within this report, “Asian American” includes Pacific Islanders. The authors cannot report data separately for Pacific Islanders due to data limitations. ↩
2. Authors’ calculations based on Bureau of the Census, “Population Estimates: Monthly Postcensal Resident Population Plus Armed Forces Overseas, By Single Year of Age, Sex, Race, and Hispanic Origin,” available at http://www.census.gov/popest/data/national/asrh/2012/2012-nat-af.html (last accessed October 2016); Karthick Ramakrishnan and Farah Z. Ahmad, “Demographics: Part of the ‘State of Asian Americans and Pacific Islanders’ Series” (Washington: Center for American Progress, 2014), available at https://cdn.americanprogress.org/wp-content/uploads/2014/04/AAPI-Demographics.pdf. ↩
3. Karthick Ramakrishnan and Farah Z. Ahmad, “Income and Poverty: Part of the ‘State of Asian Americans and Pacific Islanders’ Series” (Washington: Center for American Progress, 2014), available at https://cdn.americanprogress.org/wp-content/uploads/2014/08/AAPI-IncomePoverty.pdf. ↩
4. See, for instance, Nicholas Kristof, “The Asian Advantage,” The New York Times, October 10, 2015, available at http://www.nytimes.com/2015/10/11/opinion/sunday/the-asian-advantage.html?_r=0; Rosalind Chou and Joe Feagin, Myth of the Model Minority: Asian Americans Facing Racism (Boulder, CO: Paradigm, 2010). ↩
5. Ibid. ↩
6. See U.S. Department of Labor, The Economic Status of Asian Americans and Pacific Islanders in the Wake of the Great Recession (2014), available at https://www.dol.gov/_sec/media/reports/20140828-aapi.pdf; U.S. Department of Labor, The Economic Status of Asian Americans and Pacific Islanders (2016), available at https://www.dol.gov/_sec/media/reports/AsianLaborForce/2016AsianLaborForce.pdf; Pew Research Center, “On Views of Race and Inequality, Blacks and Whites Are Worlds Apart” (2016), available at http://www.pewsocialtrends.org/2016/06/27/on-views-of-race-and-inequality-blacks-and-whites-are-worlds-apart; The White House, “Initiative on Asian Americans and Pacific Islanders,” available at https://www.whitehouse.gov/aapi (last accessed November 2016). ↩
7. See Christian Weller, Retirement on the Rocks: Why Americans Can’t Get Ahead and How New Savings Policies Can Help (New York: Palgrave-MacMillan, 2016); Christian Weller and Michele Tolson, “Women’s Risk Exposure and Savings Inequality” (Washington: Center for American Progress, forthcoming). ↩
8. See, for example, College Board, “Trends in College Pricing 2016” (2016), Table 2a, available at https://trends.collegeboard.org/college-pricing. ↩
9. See Carmel Martin, Andy Green, and Brendan Duke, eds., “Raising Wages and Rebuilding Wealth: A Roadmap for Middle-Class Economic Security” (Washington: Center for American Progress, 2016), available at https://www.americanprogress.org/issues/economy/report/2016/09/08/143585/raising-wages-and-rebuilding-wealth. ↩
10. Jonathan Fischer and others, “Inequality and Mobility Using Income, Consumption, and Wealth for the Same Individuals.” Working Paper 2016-09 (Washington Center for Equitable Growth, 2016), available at http://equitablegrowth.org/working-papers/inequality-and-mobility-using-income-consumption-and-wealth-for-the-same-individuals. ↩
11. See Edward N. Wolff, “Household Wealth Trends in the United States, 1962–2013: What Happened Over the Great Recession?” Working Paper 20733 (National Bureau of Economic Research, 2014), available at http://www.nber.org/papers/w20733. ↩
12. Rakesh Kochar and Richard Fry, “Wealth Inequality Has Widened Along Racial, Ethnic Lines Since End of Great Recession,” Pew Research Center, December 12, 2014, available at http://www.pewresearch.org/fact-tank/2014/12/12/racial-wealth-gaps-great-recession. ↩
13. See, for example, Ray Boshara, William Emmons, and Bryan Noeth, “The Demographics of Wealth: How Age, Education and Race Separate Thrivers From Strugglers in Today’s Economy: Essay No. 1: Race, Ethnicity and Wealth” (St. Louis, MO: Federal Reserve Bank of St. Louis, 2015), available at https://www.stlouisfed.org/~/media/Files/PDFs/HFS/essays/HFS-Essay-1-2015-Race-Ethnicity-and-Wealth.pdf. ↩
14. See, for example, Farah Z. Ahmad and Christian E. Weller, “Reading Between the Data: The Incomplete Story of Asian Americans, Native Hawaiians, and Pacific Islanders” (Washington: Center for American Progress, 2014), available at https://www.americanprogress.org/issues/race/report/2014/03/03/85055/reading-between-the-data; Ramakrishnan and Ahmad, “Income and Poverty”; Karthick Ramakrishnan and Farah Z. Ahmad, “Labor-Market Outcomes: Part of the ‘State of Asian Americans and Pacific Islanders’ Series” (Washington: Center for American Progress, 2014), available at https://cdn.americanprogress.org/wp-content/uploads/2014/04/AAPI-LaborMkt.pdf. ↩
15. Ramakrishnan and Ahmad, “Income and Poverty.” ↩
16. See Martin, Green, and Duke, eds., “Raising Wages and Rebuilding Wealth.” ↩
17. See Weller, Retirement on the Rocks, for a discussion of the trends in labor, stock, and housing market volatility and their relationship to savings. ↩
18. See Weller, Retirement on the Rocks, for data on employer sponsorship of retirement plans and employer contributions to 401(k) plans. ↩
19. Other assets, such as business assets and liquid assets, are approximately equally distributed among Asian Americans and among whites. That is, the rapid growth in Asian American wealth inequality is likely a result of trends unique to housing. See Table A2 in Appendix for more details. ↩
20. Nielsen, “Asian-Americans: Culturally Connected and Forging the Future: The Asian-American Consumer 2015 Report” (2015), available at http://www.nielsencommunity.com/report_files/nielsen-asian-american-report-june-2015.pdf. ↩
21. Jacob S. Rugh, “Painting the Whole Picture: Foreclosure Rates Among Asian American Ethnic Groups in Orlando, Florida, and Phoenix, Arizona,” Asian American and Pacific Islander Journal of Health 13 (1–2): 1–29, available at https://www.researchgate.net/publication/286937212_Painting_the_Whole_Picture_Foreclosure_Rates_among_Asian_American_Ethnic_Groups_in_Orlando_Florida_and_Phoenix_Arizona. ↩
22. Christian Weller, “The U.S. Economy Is in Desperate Need of a Strong Dose of Fiscal Penicillin,” The Conversation, September 28, 2016, available at https://theconversation.com/the-u-s-economy-is-in-desperate-need-of-a-strong-dose-of-fiscal-penicillin-66106. ↩
23. Christian E. Weller, “Student Loan Debt Seems to Rise No Matter What the Economy Does: Student Debt During the Great Recession Puts Borrowers in a Bind” (Washington: Center for American Progress, 2012), available at https://www.americanprogress.org/issues/education/news/2012/05/03/11517/student-loan-debt-seems-to-rise-no-matter-what-the-economy-does. ↩
24. Table A4 in the Appendix summarizes a number of key demographic characteristics for Asian American and white households. The observed wealth inequality cannot be reconciled with those summary statistics alone. Those summary statistics, for instance, show that Asian Americans are younger than whites, which would suggest less wealth for Asian Americans than for whites. On the other hand, Asian Americans are more likely than whites to have at least a college degree, which would suggest greater access to jobs, good wages, and benefits, and consequently indicate more wealth. More importantly, the age of Asian American heads of household has been rising faster in the data than is the case for whites, which should suggest shrinking—not widening—differences in wealth inequality between Asian Americans and whites. College attainment rates have been rising at similar relative rates for Asian Americans and whites. More than two-thirds of Asian Americans had at least a college degree after the Great Recession, up from 56.6 percent in the 1990s (see Table A4)—a 21.7 percent increase. The respective increase for whites was 22.1 percent, from 34.3 percent in the 1990s to 41.8 percent in the years after the Great Recession. Wealth inequality should have risen at similar rates, possibly even at slower rates for Asian Americans than for whites, as a substantial and growing majority of Asian Americans had a college degree, which is associated with better incomes and more wealth. Put differently, something other than age and education alone has to explain the increasingly unequal distribution of wealth among Asian Americans. The more unequal distribution of jobs, wages, and benefits among Asian Americans than among whites is a likely and more consistent explanatory factor for Asian American wealth inequality. ↩
25. See, for instance, Ramakrishnan and Ahmad, “Demographics”; Ahmad and Weller, “Reading Between the Data.” ↩
26. Christian E. Weller and Teresa Ghilarducci, “Laying the Groundwork for More Efficient Retirement Savings Incentives” (Washington: Center for American Progress, 2015), available at https://www.americanprogress.org/issues/economy/reports/2015/11/18/125712/laying-the-groundwork-for-more-efficient-retirement-savings-incentives. ↩
27. Jesse Bricker and others, “Changes in U.S. Family Finances From 2010 to 2013: Evidence From the Survey of Consumer Finances,” Federal Reserve Bulletin 100 (4) (2014): 1–41, available at https://www.federalreserve.gov/pubs/bulletin/2014/pdf/scf14.pdf. ↩
28. Jesse Bricker and others, “Measuring Income and Wealth at the Top Using Administrative and Survey Data” (Washington: Board of Governors of the Federal Reserve System, 2015), available at https://www.federalreserve.gov/econresdata/feds/2015/files/2015030pap.pdf; Internal Revenue Service, Individual Income Tax Returns, 1990 (1992); O. H. Wilson and William J. Smith, “Access to Tax Records for Statistical Purposes.” In American Statistical Association, Proceedings of the Section on Survey Statistical Methods (1983). ↩
29. Arthur B. Kennickell, “Revisions to the SCF Weighting Methodology: Accounting for Race/Ethnicity and Homeownership.” Working Paper (Board of Governors of the Federal Reserve System, 1999), available at https://www.researchgate.net/publication/228577177_Revisions_to_the_SCF_Weighting_Methodology_Accounting_for_RaceEthnicity_and_Homeownership. ↩
30. The authors tested some net worth (wealth) differences for statistical significance. Specifically, the percentile differences between Asian Americans and whites in 2010–2013 are statistically significant at the 90th percentile but not at the 20th percentile. This suggests that wealth inequality is larger for Asian Americans than for whites. Detailed results are available from the authors upon request. ↩